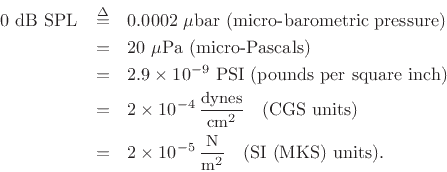
Sound Pressure Level (
SPL) is a
dB scale defined relative to a reference
that is approximately the
intensity of a 1000 Hz
sinusoid that is just
barely audible (zero ``
phons''). In
pressure units, the reference root-mean-square (rms)
amplitude for
dB SPL calculation is
F.3
The
dB SPL reference
intensity is given by
In SI units, this is
 W
W m
m
.
F.4
Since
sound is created by a time-varying pressure, we compute
sound levels in dB-SPL by using the
average fluctuation-intensity (averaged over at least one
period of the lowest frequency contained in the
sound).
The
wave impedance of air plays the role of ``resistor'' in
relating the pressure- and intensity-based references exactly
analogous to the
dBm case discussed above. Using a typical SI value
of

for the acoustic wave
impedance (calculatable as the
density of air

times the
speed of sound 
), and the basic
formula

relating intensity to rms pressure, we
calculate

, in agreement with the SI value above for the
rms-pressure-reference for dB SPL.
Table
F.1 gives a list of common sound levels and their dB
equivalents [
54]:
Table F.1:
Approximate dB-SPL level of common sounds.
(Information from S. S. Stevens, F. Warshofsky, and the Editors of
Time-Life Books, Sound and Hearing, Life Science Library,
Time-Life Books, Alexandria, VA, 1965, p. 173.)
| Sound |
dB-SPL |
| Jet engine at 3m |
140 |
| Threshold of pain |
130 |
| Rock concert |
120 |
| Accelerating motorcycle at 5m |
110 |
| Pneumatic hammer at 2m |
100 |
| Noisy factory |
90 |
| Vacuum cleaner |
80 |
| Busy traffic |
70 |
| Quiet restaurant |
50 |
| Residential area at night |
40 |
| Empty movie house |
30 |
| Rustling of leaves |
20 |
| Human breathing (at 3m) |
10 |
| Threshold of hearing (good ears) |
0 |
|
In my experience, the ``threshold of pain'' is most often defined as 120
dB.
The relationship between sound amplitude and actual
loudness is
complex [
76].
Loudness is a perceptual dimension while
sound amplitude is physical. Since loudness sensitivity is closer to
logarithmic than linear in amplitude (especially at moderate to high
loudnesses), we typically use
decibels to represent sound amplitude,
especially in spectral displays.
The
sone amplitude scale is defined in terms of actual loudness
perception experiments [
76]. At 1kHz and above,
loudness perception is approximately logarithmic above 50 dB SPL or so.
Below that, it tends toward being more linear.
The
phon amplitude scale is simply the
dB scale at 1kHz
[
76, p. 111]. At other frequencies, the amplitude in
phons is defined by following the
equal-loudness curve over to 1 kHz and
reading off the level there in dB SPL. In other words, all
pure tones have
the same loudness at the same phon level, and 1 kHz is used to set the
reference in dB SPL. Just remember that one phon is one dB-SPL at 1 kHz.
Looking at the Fletcher-Munson equal-loudness curves
[
76, p. 124], loudness in phons can be read off
along the vertical line at 1 kHz.
Classically, the
intensity level of a sound wave is its dB SPL
level, measuring the peak time-domain
pressure-wave amplitude relative to

watts per centimeter squared (
i.e., there is no consideration of
the
frequency domain here at all).
Another classical term still encountered is the
sensation level of
pure tones: The sensation level is the number of dB SPL above the
hearing threshold at that frequency [
76, p. 110].
dari: https://ccrma.stanford.edu/~jos/st/DB_SPL.html


